

Upload a dashboard screenshot, Qwen3.8-flash vision restores it as a single-file HTML with pure-CSS charts and verbatim numbers, zero external dependencies.
Upload a dashboard screenshot; the model restores it as a single-file webpage—charts in pure CSS, numbers verbatim.
This walkthrough uses a self-built e-commerce daily-ops dashboard: the screenshot has 4 KPI cards, a 7-day GMV bar chart, a channel-share bar chart, and a TOP5 product table—64 numbers total. Ask qwen3.8-flash to copy all numbers verbatim, draw charts with pure CSS only (no chart library), size bars proportionally to values, and output a single-file HTML that opens directly in a browser. The material is self-built with every number known, so the output page can be checked side-by-side with the original.
Call chain: qwen3.8-flash (dashboard screenshot base64 input → single-file HTML). Vision understanding, zero external dependencies.
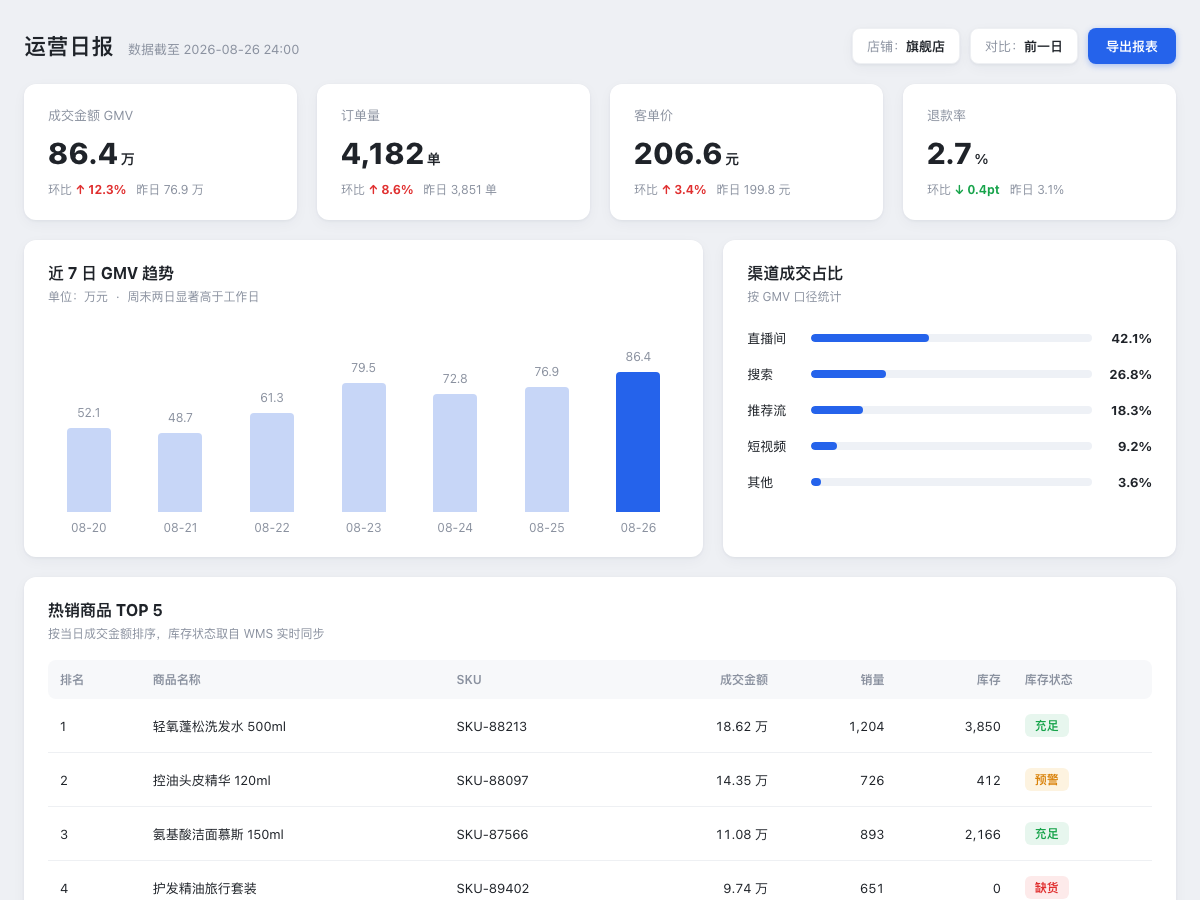 Measured output · model-restored page
Click to try: Ops daily dashboard · restored output page
Measured output · model-restored page
Click to try: Ops daily dashboard · restored output page
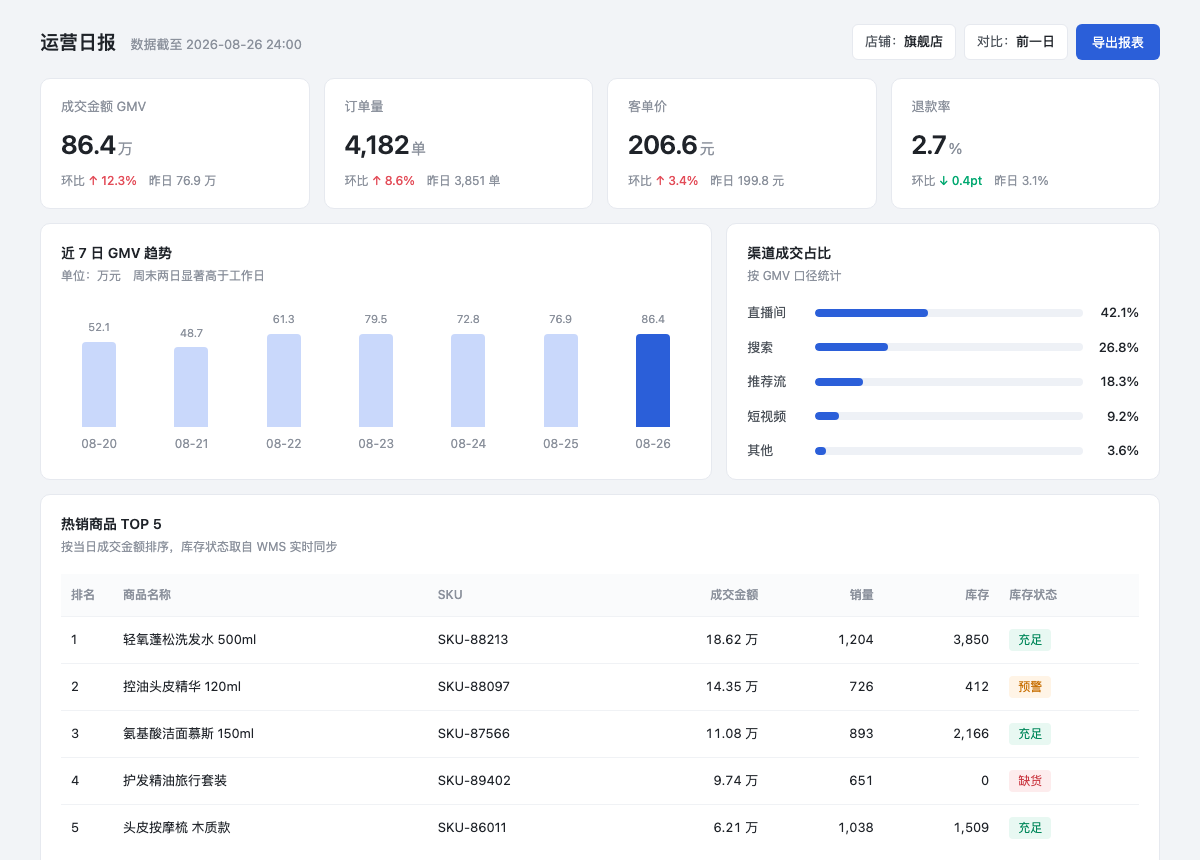 Example input · full dashboard screenshot fed to the model (self-built material, not from the web)
Disclaimer: All content on this page is AI-generated, for reference only, and does not constitute any performance guarantee. Actual results and Credits consumption are subject to the console "Usage Details".
Measured output
The restored page after both rounds:Example input
Step 1: upload screenshot and give restore requirements
Send the dashboard screenshot along with the prompt below to qwen3.8-flash:Copy
<image_url: base64 149 KB>
Restore this ops dashboard screenshot into HTML/CSS code. Requirements:
① All numbers, product names, SKU codes, dates: copy verbatim from the screenshot; do not fabricate;
② Bar chart and horizontal bar chart: draw with pure CSS; bar heights and bar lengths must be proportional to the values in the screenshot; do not introduce ECharts or any external dependency;
③ KPI card up/down deltas: keep screenshot colors (up=red, down=green); inventory status three-color tags must have correct semantic colors;
④ Layout: use Flex/Grid, responsive;
⑤ Output a single complete HTML file that can be opened directly in a browser.
Step 2: paste the output back, add button interaction
Round 1 only asked for "restore structure," so the "Export Report" button on the output page is static. Paste the previous HTML back, add only the interaction requirement (and write "everything else must not change" into the prompt):Copy
This is the complete HTML you produced last round from the ops dashboard screenshot. Now add one thing.

Problem: the "Export Report" button in the top-right doesn't respond when clicked.

Requirements:
① Add working interaction to "Export Report"; pure front-end mock, no external dependencies or network resources;
② On click, export the "Top 5 Products" table headers and all rows as CSV and trigger a browser download;
   filename should include the data date from the page header; CSV must have UTF-8 BOM to avoid Chinese garbling in Excel;
③ On click, also provide an in-page visible status feedback (e.g., button briefly changes to "exporting,"
   then a success toast that auto-dismisses after 2-3 seconds), because some browsers block downloads;
   as long as the feedback is shown, the user can confirm the button responded;
④ Except for the new code needed to implement the above interaction, all numbers, copy, tags,
   structure hierarchy, colors and spacing must not be changed—not a single character;
⑤ Still output only one complete HTML file that can be opened directly in a browser.

<Previous-round output pasted back with the prompt: 247 lines of HTML>
Show View measured output · complete single-file HTML after adding export interaction (338 lines, openable directly)
Show View measured output · complete single-file HTML after adding export interaction (338 lines, openable directly)
Copy
<!DOCTYPE html>
<html lang="zh-CN">
<head>
<meta charset="UTF-8">
<meta name="viewport" content="width=device-width, initial-scale=1.0">
<title>运营日报</title>
<style>
  :root{
    --bg:#eef0f4;
    --card:#ffffff;
    --ink:#1f2329;
    --muted:#8a919f;
    --line:#eef0f3;
    --blue:#2563eb;
    --blue-soft:#c7d6f7;
    --red:#e02f2f;
    --green:#16a34a;
    --orange:#d9820a;
    --radius:12px;
    --shadow:0 1px 3px rgba(30,40,70,.06),0 4px 14px rgba(30,40,70,.04);
  }
  *{box-sizing:border-box;margin:0;padding:0;}
  body{
    font-family:-apple-system,BlinkMacSystemFont,"Segoe UI","PingFang SC","Hiragino Sans GB","Microsoft YaHei",sans-serif;
    background:var(--bg);
    color:var(--ink);
    padding:28px 24px;
    -webkit-font-smoothing:antialiased;
  }
  .wrap{max-width:1180px;margin:0 auto;display:flex;flex-direction:column;gap:20px;}

  /* ---------- Top bar ---------- */
  .topbar{display:flex;align-items:center;justify-content:space-between;gap:16px;flex-wrap:wrap;}
  .topbar-title{display:flex;align-items:baseline;gap:14px;flex-wrap:wrap;}
  .topbar-title h1{font-size:22px;font-weight:700;letter-spacing:.5px;}
  .asof{font-size:13px;color:var(--muted);}
  .topbar-actions{display:flex;align-items:center;gap:10px;flex-wrap:wrap;}
  .pill{
    background:var(--card);border:1px solid var(--line);border-radius:8px;
    padding:8px 14px;font-size:13px;color:var(--muted);box-shadow:var(--shadow);
  }
  .pill b{color:var(--ink);font-weight:600;}
  .btn{
    background:var(--blue);color:#fff;border:none;border-radius:8px;
    padding:9px 18px;font-size:13px;font-weight:600;cursor:pointer;
    box-shadow:0 2px 6px rgba(37,99,235,.35);
  }
  .btn:hover{background:#1d55d4;}

  /* ---------- Card common ---------- */
  .card{background:var(--card);border-radius:var(--radius);box-shadow:var(--shadow);padding:22px 24px;}
  .panel-title{font-size:16px;font-weight:700;margin-bottom:4px;}
  .panel-sub{font-size:12px;color:var(--muted);margin-bottom:18px;}
  .panel-sub .sep{margin:0 8px;}

  /* ---------- KPI ---------- */
  .kpi-grid{display:grid;grid-template-columns:repeat(4,1fr);gap:20px;}
  .kpi-label{font-size:13px;color:var(--muted);margin-bottom:12px;}
  .kpi-value{font-size:30px;font-weight:800;letter-spacing:.5px;line-height:1.1;}
  .kpi-value span{font-size:14px;font-weight:600;color:var(--ink);margin-left:2px;}
  .kpi-foot{margin-top:12px;font-size:12px;color:var(--muted);display:flex;gap:10px;flex-wrap:wrap;}
  .delta{font-weight:700;}
  .delta.up{color:var(--red);}
  .delta.down{color:var(--green);}

  /* ---------- Mid two-column ---------- */
  .mid-grid{display:grid;grid-template-columns:1.5fr 1fr;gap:20px;}

  /* Bar chart */
  .bars{display:flex;align-items:flex-end;justify-content:space-between;gap:10px;height:212px;padding-top:8px;}
  .bar-col{flex:1;display:flex;flex-direction:column;align-items:center;justify-content:flex-end;height:100%;gap:8px;min-width:0;}
  .bar-val{font-size:12px;color:var(--muted);}
  .bar{width:56%;max-width:44px;min-width:20px;background:var(--blue-soft);border-radius:4px 4px 0 0;}
  .bar.hot{background:var(--blue);}
  .bar-day{font-size:12px;color:var(--muted);}

  /* Horizontal bar chart */
  .hbars{display:flex;flex-direction:column;gap:18px;padding-top:6px;}
  .hbar{display:grid;grid-template-columns:52px 1fr 48px;align-items:center;gap:12px;}
  .hbar-name{font-size:13px;color:var(--ink);}
  .hbar-track{height:8px;background:#eef1f6;border-radius:99px;overflow:hidden;}
  .hbar-fill{height:100%;background:var(--blue);border-radius:99px;}
  .hbar-val{font-size:13px;font-weight:700;text-align:right;}

  /* ---------- Table ---------- */
  .table-scroll{overflow-x:auto;}
  table{width:100%;border-collapse:collapse;font-size:13px;min-width:720px;}
  thead th{
    text-align:left;color:var(--muted);font-weight:600;font-size:12px;
    background:#f7f8fa;padding:11px 12px;
  }
  thead th:first-child{border-radius:8px 0 0 8px;}
  thead th:last-child{border-radius:0 8px 8px 0;}
  tbody td{padding:15px 12px;border-bottom:1px solid var(--line);vertical-align:middle;}
  tbody tr:last-child td{border-bottom:none;}
  .num{text-align:right;font-variant-numeric:tabular-nums;}
  thead .num{text-align:right;}
  .tag{display:inline-block;padding:3px 10px;border-radius:6px;font-size:12px;font-weight:600;}
  .tag.ok{background:#e7f6ee;color:var(--green);}
  .tag.warn{background:#fdf3e0;color:var(--orange);}
  .tag.err{background:#fdeaea;color:var(--red);}

  /* ---------- Responsive ---------- */
  @media (max-width:960px){
    .kpi-grid{grid-template-columns:repeat(2,1fr);}
    .mid-grid{grid-template-columns:1fr;}
  }
  @media (max-width:560px){
    body{padding:16px;}
    .kpi-grid{grid-template-columns:1fr;}
    .topbar{flex-direction:column;align-items:flex-start;}
    .bar{width:70%;}
  }
</style>
</head>
<body>
<div class="wrap">

  <!-- Top bar -->
  <header class="topbar">
    <div class="topbar-title">
      <h1>运营日报</h1>
      <span class="asof">数据截至 2026-08-26 24:00</span>
    </div>
    <div class="topbar-actions">
      <div class="pill">店铺:<b>旗舰店</b></div>
      <div class="pill">对比:<b>前一日</b></div>
      <button class="btn">导出报表</button>
    </div>
  </header>

  <!-- KPI cards -->
  <section class="kpi-grid">
    <div class="card">
      <div class="kpi-label">成交金额 GMV</div>
      <div class="kpi-value">86.4<span>万</span></div>
      <div class="kpi-foot">
        <span>环比 <span class="delta up">↑ 12.3%</span></span>
        <span>昨日 76.9 万</span>
      </div>
    </div>
    <div class="card">
      <div class="kpi-label">订单量</div>
      <div class="kpi-value">4,182<span>单</span></div>
      <div class="kpi-foot">
        <span>环比 <span class="delta up">↑ 8.6%</span></span>
        <span>昨日 3,851 单</span>
      </div>
    </div>
    <div class="card">
      <div class="kpi-label">客单价</div>
      <div class="kpi-value">206.6<span>元</span></div>
      <div class="kpi-foot">
        <span>环比 <span class="delta up">↑ 3.4%</span></span>
        <span>昨日 199.8 元</span>
      </div>
    </div>
    <div class="card">
      <div class="kpi-label">退款率</div>
      <div class="kpi-value">2.7<span>%</span></div>
      <div class="kpi-foot">
        <span>环比 <span class="delta down">↓ 0.4pt</span></span>
        <span>昨日 3.1%</span>
      </div>
    </div>
  </section>

  <!-- Mid: trend + channels -->
  <section class="mid-grid">
    <div class="card">
      <h2 class="panel-title">近 7 日 GMV 趋势</h2>
      <p class="panel-sub">单位:万元<span class="sep">·</span>周末两日显著高于工作日</p>
      <div class="bars">
        <div class="bar-col"><span class="bar-val">52.1</span><div class="bar" style="height:84px"></div><span class="bar-day">08-20</span></div>
        <div class="bar-col"><span class="bar-val">48.7</span><div class="bar" style="height:79px"></div><span class="bar-day">08-21</span></div>
        <div class="bar-col"><span class="bar-val">61.3</span><div class="bar" style="height:99px"></div><span class="bar-day">08-22</span></div>
        <div class="bar-col"><span class="bar-val">79.5</span><div class="bar" style="height:129px"></div><span class="bar-day">08-23</span></div>
        <div class="bar-col"><span class="bar-val">72.8</span><div class="bar" style="height:118px"></div><span class="bar-day">08-24</span></div>
        <div class="bar-col"><span class="bar-val">76.9</span><div class="bar" style="height:125px"></div><span class="bar-day">08-25</span></div>
        <div class="bar-col"><span class="bar-val">86.4</span><div class="bar hot" style="height:140px"></div><span class="bar-day">08-26</span></div>
      </div>
    </div>

    <div class="card">
      <h2 class="panel-title">渠道成交占比</h2>
      <p class="panel-sub">按 GMV 口径统计</p>
      <div class="hbars">
        <div class="hbar"><span class="hbar-name">直播间</span><div class="hbar-track"><div class="hbar-fill" style="width:42.1%"></div></div><span class="hbar-val">42.1%</span></div>
        <div class="hbar"><span class="hbar-name">搜索</span><div class="hbar-track"><div class="hbar-fill" style="width:26.8%"></div></div><span class="hbar-val">26.8%</span></div>
        <div class="hbar"><span class="hbar-name">推荐流</span><div class="hbar-track"><div class="hbar-fill" style="width:18.3%"></div></div><span class="hbar-val">18.3%</span></div>
        <div class="hbar"><span class="hbar-name">短视频</span><div class="hbar-track"><div class="hbar-fill" style="width:9.2%"></div></div><span class="hbar-val">9.2%</span></div>
        <div class="hbar"><span class="hbar-name">其他</span><div class="hbar-track"><div class="hbar-fill" style="width:3.6%"></div></div><span class="hbar-val">3.6%</span></div>
      </div>
    </div>
  </section>

  <!-- Top products table -->
  <section class="card">
    <h2 class="panel-title">热销商品 TOP 5</h2>
    <p class="panel-sub">按当日成交金额排序,库存状态取自 WMS 实时同步</p>
    <div class="table-scroll">
      <table>
        <thead>
          <tr>
            <th>排名</th>
            <th>商品名称</th>
            <th>SKU</th>
            <th class="num">成交金额</th>
            <th class="num">销量</th>
            <th class="num">库存</th>
            <th>库存状态</th>
          </tr>
        </thead>
        <tbody>
          <tr>
            <td>1</td><td>轻氧蓬松洗发水 500ml</td><td>SKU-88213</td>
            <td class="num">18.62 万</td><td class="num">1,204</td><td class="num">3,850</td>
            <td><span class="tag ok">充足</span></td>
          </tr>
          <tr>
            <td>2</td><td>控油头皮精华 120ml</td><td>SKU-88097</td>
            <td class="num">14.35 万</td><td class="num">726</td><td class="num">412</td>
            <td><span class="tag warn">预警</span></td>
          </tr>
          <tr>
            <td>3</td><td>氨基酸洁面慕斯 150ml</td><td>SKU-87566</td>
            <td class="num">11.08 万</td><td class="num">893</td><td class="num">2,166</td>
            <td><span class="tag ok">充足</span></td>
          </tr>
          <tr>
            <td>4</td><td>护发精油旅行套装</td><td>SKU-89402</td>
            <td class="num">9.74 万</td><td class="num">651</td><td class="num">0</td>
            <td><span class="tag err">缺货</span></td>
          </tr>
          <tr>
            <td>5</td><td>头皮按摩梳 木质款</td><td>SKU-86011</td>
            <td class="num">6.21 万</td><td class="num">1,038</td><td class="num">1,509</td>
            <td><span class="tag ok">充足</span></td>
          </tr>
        </tbody>
      </table>
    </div>
  </section>

</div>

<script>
(function () {
  const btn = document.querySelector('.btn');
  const asof = document.querySelector('.asof');
  const table = document.querySelector('.table-scroll table');
  if (!btn || !asof || !table) return;

  const originalText = btn.textContent;
  let busy = false;

  function escapeCsv(value) {
    const text = String(value);
    return /[",\r\n]/.test(text) ? '"' + text.replace(/"/g, '""') + '"' : text;
  }

  function showToast(message) {
    const oldToast = document.getElementById('export-toast');
    if (oldToast && oldToast.parentNode) oldToast.parentNode.removeChild(oldToast);

    const toast = document.createElement('div');
    toast.id = 'export-toast';
    toast.setAttribute('role', 'status');
    toast.textContent = message;
    toast.style.cssText = 'position:fixed;right:24px;bottom:24px;z-index:9999;background:#16a34a;color:#ffffff;font-size:13px;font-weight:600;padding:10px 14px;border-radius:8px;box-shadow:0 1px 3px rgba(30,40,70,.06),0 4px 14px rgba(30,40,70,.04);opacity:0;transition:opacity .2s;pointer-events:none;';
    document.body.appendChild(toast);

    requestAnimationFrame(function () {
      toast.style.opacity = '1';
    });

    setTimeout(function () {
      toast.style.opacity = '0';
      setTimeout(function () {
        if (toast.parentNode) toast.parentNode.removeChild(toast);
      }, 250);
    }, 2200);
  }

  btn.addEventListener('click', function () {
    if (busy) return;
    busy = true;

    btn.style.minWidth = btn.offsetWidth + 'px';
    btn.textContent = '导出中';

    setTimeout(function () {
      try {
        const dateMatch = asof.textContent.match(/(\d{4}-\d{2}-\d{2})/);
        const dataDate = dateMatch ? dateMatch[1] : new Date().toISOString().slice(0, 10);

        const headers = Array.from(table.querySelectorAll('thead th')).map(function (th) {
          return th.textContent.trim();
        });

        const rows = Array.from(table.querySelectorAll('tbody tr')).map(function (tr) {
          return Array.from(tr.children).map(function (td) {
            return td.textContent.trim();
          });
        });

        const csv = [headers].concat(rows).map(function (row) {
          return row.map(escapeCsv).join(',');
        }).join('\r\n');

        const blob = new Blob(['\uFEFF' + csv], { type: 'text/csv;charset=utf-8' });
        const url = URL.createObjectURL(blob);
        const link = document.createElement('a');
        link.href = url;
        link.download = '运营日报_热销商品TOP5_' + dataDate + '.csv';
        link.style.display = 'none';
        document.body.appendChild(link);
        link.click();

        setTimeout(function () {
          if (link.parentNode) link.parentNode.removeChild(link);
          URL.revokeObjectURL(url);
        }, 1000);

        showToast('导出成功,CSV 已开始下载');
      } catch (err) {
        showToast('导出失败,请重试');
      } finally {
        btn.textContent = originalText;
        btn.style.minWidth = '';
        busy = false;
      }
    }, 700);
  });
})();
</script>
</body>
</html>
Notes
- Consumption: This playbook uses vision understanding + text generation (qwen3.8-flash). The screenshot converts to image_tokens on the input side; larger/clearer images mean higher input cost. Output is a complete single-file HTML, so output-side consumption is higher than plain-text Q&A—normal.
- Note: Layout is rewritten with Flex/Grid—structural-level restore, not pixel-perfect reproduction. Colors and spacing have minor differences from the original. For high-fidelity reproduction, use the design mockup as the source of truth.
- Note: Before screenshot restoration, confirm you have the right to use the page's design and data. The material in this example is self-built.